System State
Navigation: Diagnostics > System State
The System State page is the dashboard shown by default after login and the primary starting point for diagnostics. It presents the device's operating condition at a glance in a set of cards: device identity and firmware, runtime and load, resource usage, a graphical network topology, remote-service (VPN) status, cellular status, a live traffic graph, and the latest log messages — without navigating to individual pages.
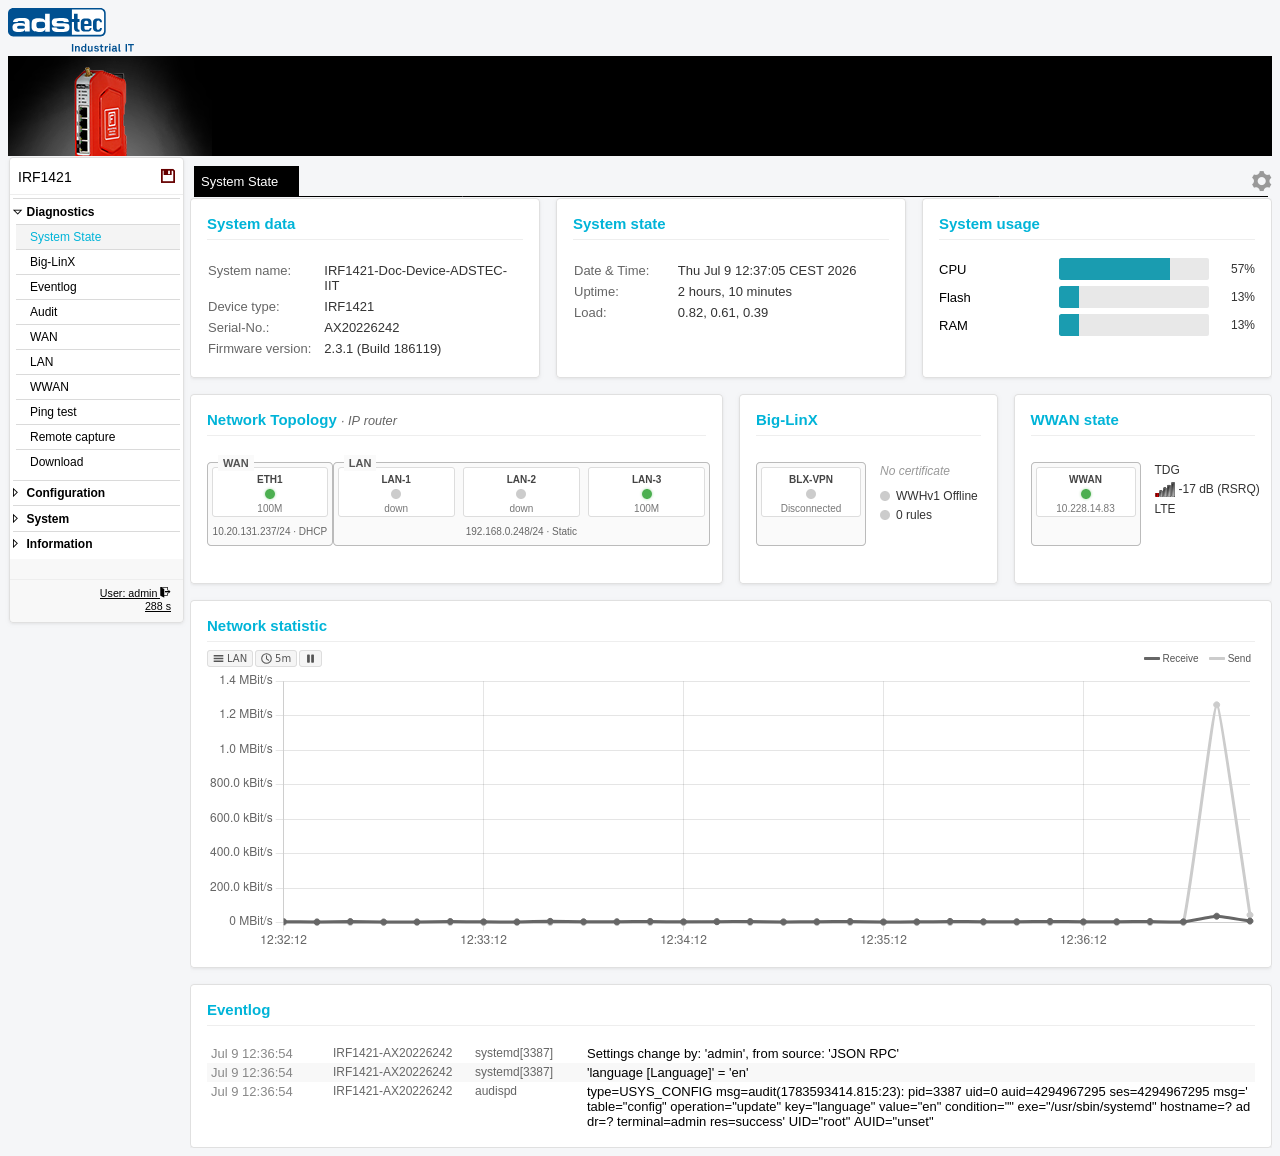
System data
Device identity and hardware information:
- System name
- The configured hostname of the device.
- Device type
- The hardware model designation.
- Serial-No.
- The unique serial number assigned during manufacturing.
- Firmware version
- The currently installed firmware version, with the build number in parentheses.
System state
Runtime and time information:
- Date & Time
- The current system date and time, including the configured timezone.
- Uptime
- The elapsed time since the last boot.
- Load
- The system load averages over the last 1, 5, and 15 minutes. Persistently high values may indicate resource contention.
System usage
Resource-utilization bars, each shown as a percentage. Hover over a bar for the exact figures (the CPU user/kernel split; Flash and RAM used/total in MB):
- CPU
- Current processor utilization.
- Flash
- Usage of the internal /nvram data partition, which holds the device configuration and the audit log. Docker container storage uses a separate partition and is not included in this value.
- RAM
- Working memory in use. Elevated usage can occur when running Docker containers or processing large volumes of IoT data.
Network topology
A graphical map of the device's Ethernet ports, grouped by their bridge assignment (e.g. WAN (br1) and LAN (br0)), with the current operational mode shown next to the heading (IP router or transparent bridge). Each port tile shows the port name, a status indicator, and the negotiated link speed (e.g. 1G, 100M) for connected ports; disconnected ports are marked down and greyed out. The IP address, subnet mask, and assignment (Static or DHCP) of each bridge are shown beneath its ports.
Note
The port MAC addresses are not shown inline. Hover the mouse pointer over a port tile to see that port's MAC address as a tooltip.
Big-LinX
Status of the Big-LinX remote-service connection:
- VPN connection
- The state of the remote-service VPN tunnel (BLX-VPN) — connected (with the assigned tunnel IP) or disconnected.
- Server status
- Whether the remote-management server is reachable (Online / Offline).
- Certificate
- The installed remote-service certificate, or No certificate if none is present.
- Forwarding
- The number of active Big-LinX port forwardings (configured under Big-LinX → Port forwarding), shown as "N rules". These are remote-access port forwardings — not packet-filter rules.
WWAN state
Visible when the device is equipped with a cellular modem:
- WWAN connection
- The cellular connection state and the assigned IP address.
- Provider
- The mobile network operator the modem is registered with.
- Signal quality
- The received signal strength (dBm / RSRQ) and the radio access technology (e.g. LTE).
Network statistic
A real-time traffic graph. Use the interface selector to choose which interface to plot and the time-window control (e.g. 5m) to set the displayed period; the graph can be paused. Separate Receive and Send lines plot throughput over time, helping identify traffic patterns or bottlenecks.
Eventlog
The most recent system-event entries — authentication events, configuration changes, and system notifications — each with a timestamp, the device serial number, the originating service, and the message text. For the complete, filterable log, open the Eventlog page.