Ethernet
Navigation: Diagnostics > Ethernet
The Ethernet diagnostics page displays the current link status and traffic statistics for the physical Ethernet ports of the device. Use this page to verify that the Ethernet link is active, confirm the negotiated link speed and duplex mode, and monitor packet counters for signs of transmission errors or network problems. Elevated values for dropped packets, overrun packets, or collisions may indicate cabling issues, duplex mismatches, or network congestion that require further investigation.
Each physical Ethernet port is shown as a separate tab at the top of the page. The device is available in 4-port and 8-port hardware versions, so — depending on the model — the tabs range from ETH1…ETH4 to ETH1…ETH8. All ports are identical, so this page describes ETH1 as a representative example; the other tabs show the same fields for their respective port.
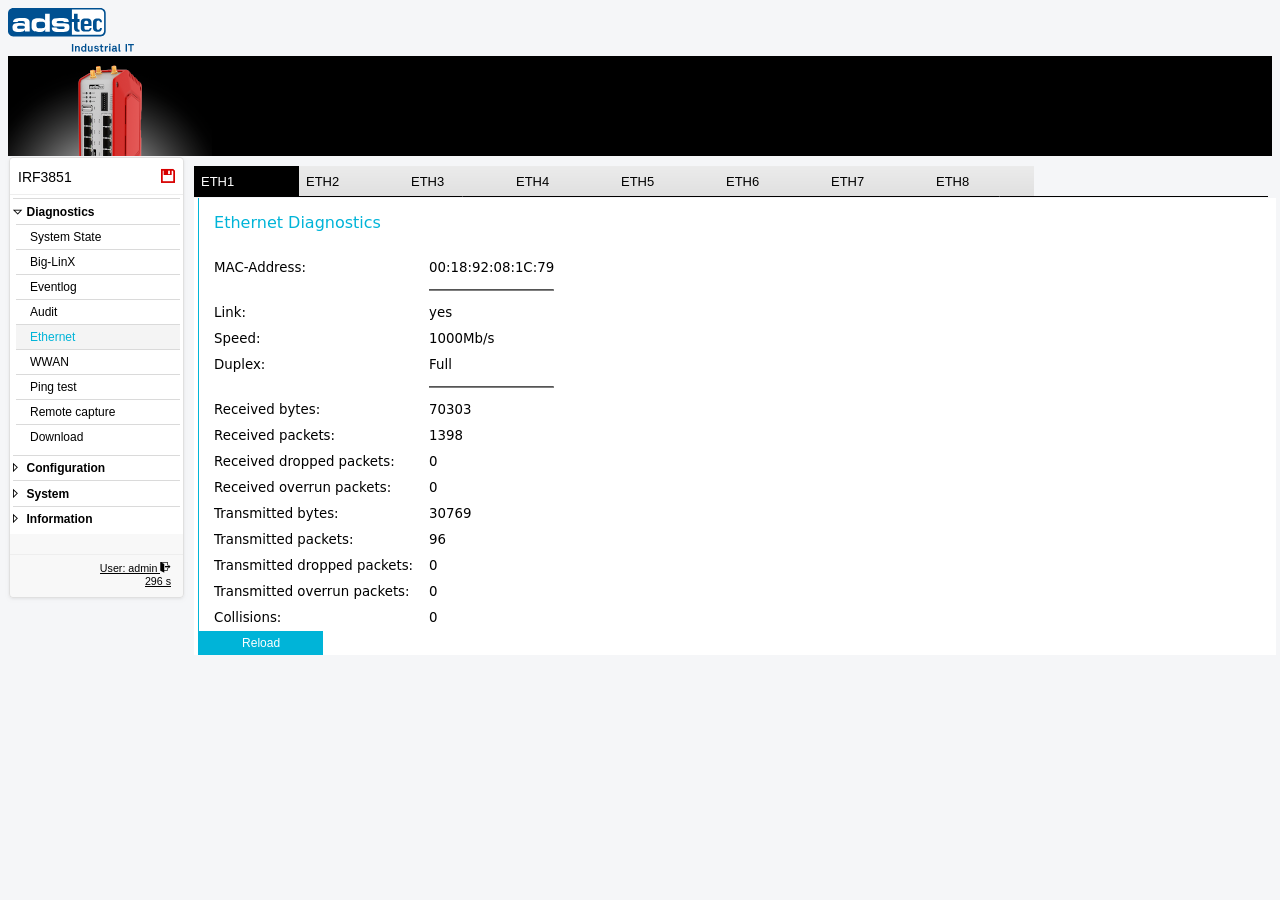
Link information
The upper section displays the physical link parameters for the selected Ethernet port:
- MAC-Address
- The hardware MAC address assigned to the Ethernet interface.
- Link
- The current link state of the port — yes if a cable is connected and a link is established, no if no active link is detected. If the link state shows no, check the cable connection and the remote switch or router.
- Speed
- The negotiated link speed (e.g., 10Mb/s, 100Mb/s, or 1000Mb/s). This value reflects the speed agreed upon during auto-negotiation with the connected device. The speed can be configured manually on the Ethernet configuration page.
- Duplex
- The negotiated duplex mode — Full (simultaneous send and receive) or Half (alternating send and receive). Full duplex is standard for modern Ethernet connections. A half-duplex link may indicate a duplex mismatch, which can cause significant performance degradation and increased collisions.
Traffic statistics
The lower section displays cumulative packet and byte counters for the selected Ethernet port since the last device reboot:
- Received bytes
- The total number of bytes received on this port.
- Received packets
- The total number of packets received on this port.
- Received dropped packets
- The number of received packets that were dropped by the system, for example due to buffer overflows or filtering rules. A non-zero value may indicate resource constraints or high traffic load.
- Received overrun packets
- The number of received packets lost because the interface buffer was full and could not process incoming data fast enough. Persistent overruns may indicate that the connected network segment is generating more traffic than the interface can handle.
- Transmitted bytes
- The total number of bytes transmitted from this port.
- Transmitted packets
- The total number of packets transmitted from this port.
- Transmitted dropped packets
- The number of outbound packets that were dropped before transmission. This can occur due to queue overflow or system resource limitations.
- Transmitted overrun packets
- The number of outbound packets lost due to transmit buffer overruns.
- Collisions
- The number of Ethernet collisions detected on this port. Collisions typically occur only on half-duplex links or in the presence of network wiring issues. On a properly configured full-duplex link, this counter should remain at zero. A rising collision count on a link reported as full duplex indicates a duplex mismatch with the connected switch or router.
Note
All traffic counters are reset to zero when the device is rebooted. The counters represent cumulative values since the last system start.
Related pages
- To configure Ethernet port settings such as link speed and duplex mode, see the Ethernet configuration page.
- For IP address assignment and operational mode of the network interfaces, see IP configuration.
- For link aggregation settings that combine multiple Ethernet ports, see Bonding.
Click Reload to refresh the displayed values with the current statistics from the device.