Metrics
Navigation: Configuration > IoT > Data > Metrics
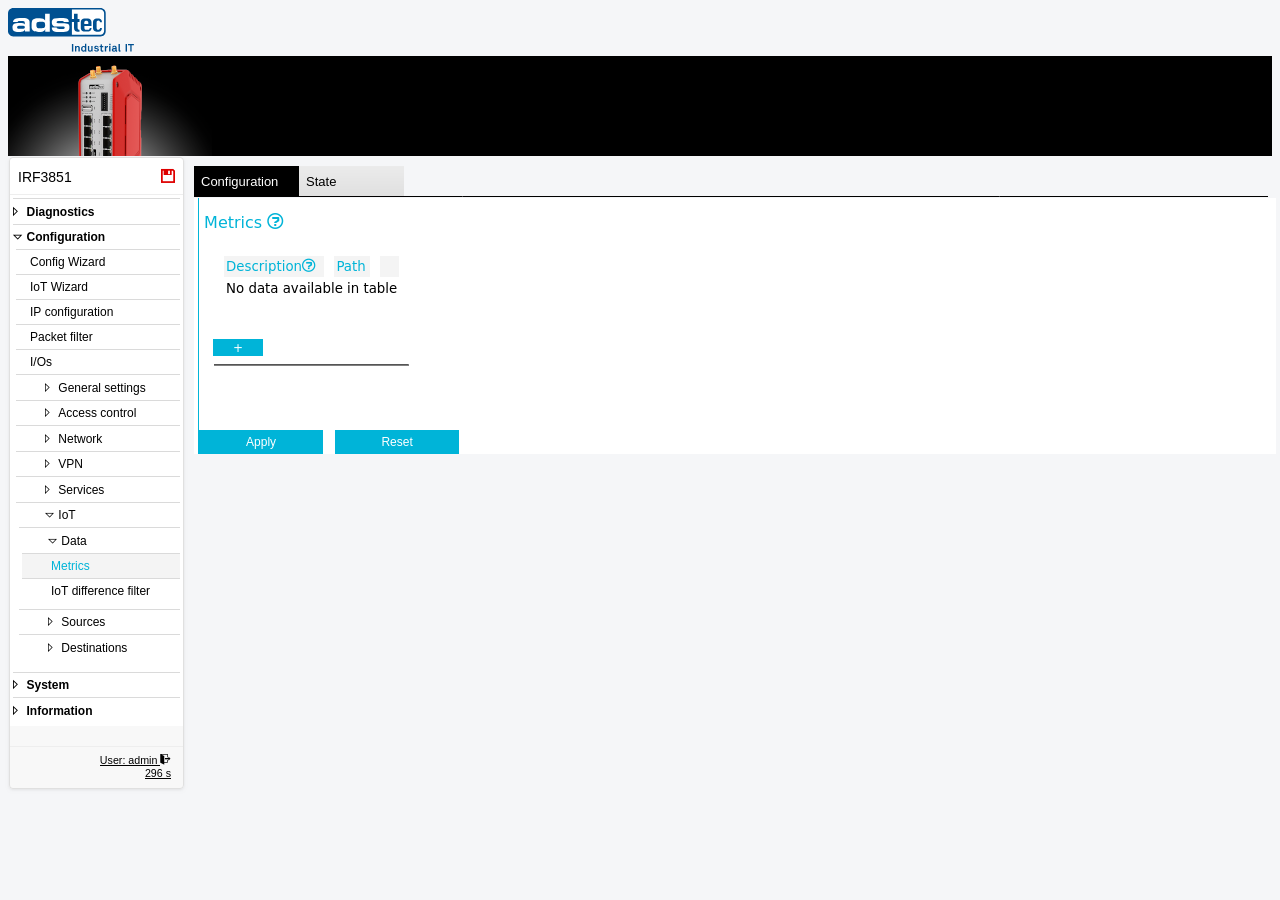
The Metrics page defines the list of all data points (metrics) that the IoT gateway on the device collects and forwards. Each metric represents a single measurable value — such as a temperature reading, a counter, or a status flag — and must be assigned to a dataset identified by its path. Once metrics are defined here, they are available for mapping to physical data sources on the individual source configuration pages (for example Modbus/RTU metrics, Modbus/TCP metrics, or OPC UA metrics). The collected metric values can then be transmitted to external systems via the configured IoT destinations such as Big-LinX IoT push or MQTT destination. Before metric values are sent, they can optionally be processed by the IoT difference filter to transmit only changed values and reduce data volume.
Prerequisites
- At least one IoT data source must be available or planned (e.g., a Modbus RTU device, a Modbus TCP server, or an OPC UA server) so that the metrics defined here can later be mapped to actual source data.
- At least one IoT destination (Big-LinX IoT push or MQTT destination) should be configured for the collected metrics to be forwarded.
Settings
Metrics table
The table lists all metrics currently defined on the device. Each row represents one metric. Use the + button below the table to add a new metric entry. To remove a metric, delete its row from the table.
- Description
- A free-text label for the metric. This field is intended for documentation and usability purposes — it helps identify the metric in the configuration interface and in source mapping pages. Choose a meaningful name that describes the physical quantity or signal being measured (e.g., "Motor temperature", "Line pressure", "Conveyor speed").
- Path
- The dataset path that identifies the metric within the IoT data structure. The path defines how the metric is organized and addressed when it is transmitted to IoT destinations. Each metric must be assigned to a dataset via its path. Use a hierarchical notation to group related metrics logically (e.g., "plant1/line2/temperature").
After adding or modifying metrics, click Apply settings to activate the changes. The metrics then become available for source mapping on the respective source configuration pages. To persist the configuration across reboots, save the settings via the Save page.
Note
The Metrics page only defines the data points and their metadata. The actual data acquisition — which protocol is used, which register or node is read, and at what interval — is configured on the individual source mapping pages under Configuration > IoT > Sources.